
Welcome to a series of blog posts about how PureClarity utilises AWS DynamoDB for data storage. I’ll discuss how we use it and perhaps more interestingly, some of the challenges we’ve faced over the years.
What does our database architecture look like?
PureClarity runs entirely on AWS (for now!). All our compute resources are architected as microservices. Our data storage pipeline is “connected” via queues (SQS of course). This means traffic peaks, failures or upgrades don’t affect the data being ingested. The queues can fill up and then the messages are processed when there is compute resource to do so. This could easily be converted to be serverless, such as AWS Lambda if we wanted to.
Nothing interesting so far - this is fairly standard. What is interesting is how we try to minimise our write costs.
Read the AWS pricing fine print!
When we started we didn’t account for the fact that DynamoDB is cheap for reads, but expensive for writes. Guess what - PureClarity is actually more write than read heavy! From the start we therefore were battling the costs of writing to Dynamo. In the early days we didn’t utilise redis, so all data during a customer's session was stored in DynamoDB on every page view. This meant a LOT of DynamoDB writes!
DynamoDB Provisioning - urgh
DynamoDB is priced based on your provisioning level, i.e. you pay for the number of read and write operations you want to use. If you want to write faster - you pay more, and then you are allowed to write at a faster rate.
NOTE: You can specify on-demand, but it is significantly more expensive for our use case.
When we started PureClarity there was no automated way of scaling the provisioning up or down. We also split our data over far too many tables (DynamoDB design is a topic for another day). As data from our clients is time based (people don’t really browse e-commerce stores in the middle of the night), we needed to find a way to scale the table provisioning up and down. We had far too much spare capacity that we were paying for but not using. Combined with the number of writes, it was all very expensive!
Initial Architecture
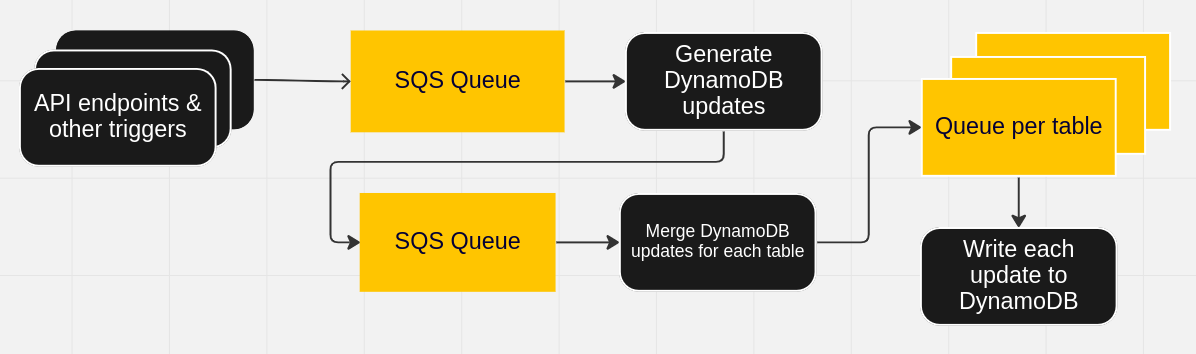
Data from API endpoints and other triggers (such as session expiry) is passed to a queue. A micro service transforms these messages based on our business logic into inserts and updates for DynamoDB. These go onto a queue, where another microservice merges messages where it can.
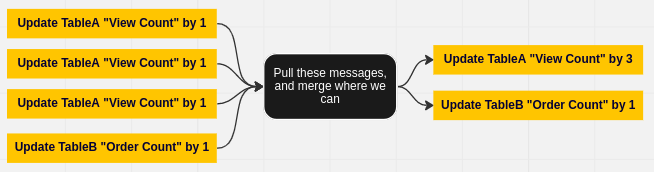
This “merge” step has saved us a lot of money over the years. It identifies similar messages for each DynamoDB table based on the table keys, and then merges the attributes. Instead of doing updates where the same attribute is incremented separately, it converts them into a single update where the attribute is incremented by the value of both combined.
Over time we’ve moved away from this “merge” step quite a bit - by storing data in redis. I’ll write about this in another post.
This “merge” service adds to, you guessed it - more queues! For this final stage of our message ingestion we have a queue per table.
Finally, we have another microservice that pulls messages off the queues and writes to DynamoDB at the maximum rate we have provisioned. We cannot write faster, as DynamoDB will throttle your requests.
Setting DynamoDB provisioning
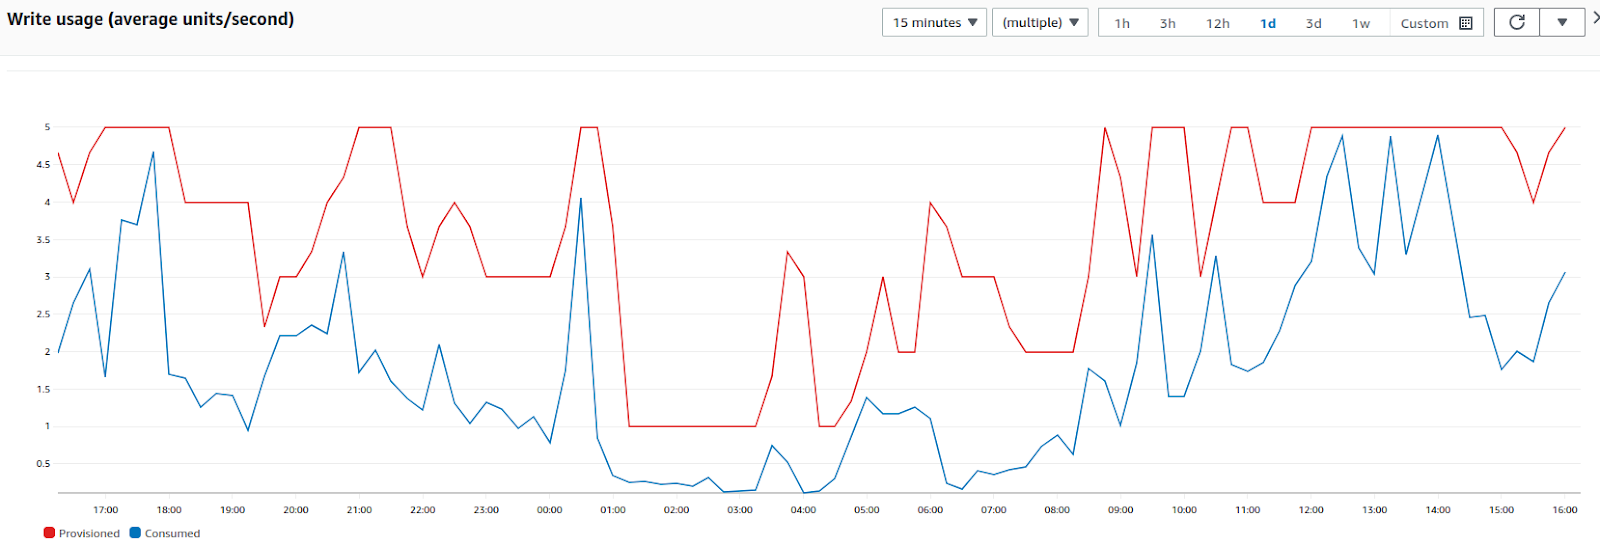
his explains the architecture - but what about provisioning? In the beginning we had yet another microservice that would monitor the rate we were writing to the tables, and look at the provisioned limit on each table. It would then increment/decrement the provisioning accordingly. This means that when traffic increases, the service writes as fast as it is allowed (the provisioned max for the table). The microservice would spot the write level was the same as provisioned level, and increase the provisioning after a few minutes. The service updated the rate it could write, and data was then ingested faster. The reverse happens when the load drops. We don’t write as often, and the service reduced the provisioning. I’ve included a graph of the provisioned level (cost to us) and the actual write level over a 24hr period for one of our tables.
This is a whole lot of complexity just to try to reduce our DynamoDB costs - so you can imagine the costs we were seeing that caused us to invest so much time trying to reduce them!
A nice addition to DynamoDB was the introduction of “Auto Scaling”. AWS can now manage the scaling up and down for you. This meant we could remove our microservice that altered the provisions. We now write as fast as we can, and AWS takes care of scaling up or down. We set the maximum level we allow, and don’t have to worry about it.
Note however that DynamoDB will only perform so many provisioning decrements in a 24hr time period. This means if you are not careful, it over provisions and then you are left paying more than you need to as it cannot do enough drops back in provisioning. It is a careful balancing act to not over provision, and pay too much - or under provision and have the queues back up.
Next post
In the next post I’ll discuss in more detail about how we store our data in DynamoDB, and some of the ways we’ve used redis to help reduce the amount of data we write to DynamoDB, but still allowing near real-time stats in our dashboard.